ROI on Vacation Rentals in Hurghada: Realistic Numbers
Discover real rental yields, occupancy rates, and income potential for Hurghada real estate in 2026. Data-driven insights on vacation rentals, seasonality, and ROI in Egypt’s Red Sea market.


What yields, occupancy rates, and income can you actually expect? We break down the data - without the sales pitch.
7–10%Gross rental yield
|
53%Median occupancy
|
12moTourism season
|
In this guide
01 Why Hurghada works as an investment market
02 Rental yield data: the actual numbers
03 Understanding Hurghada's seasonality
04 A worked example: what your numbers might look like
05 Short-term vs long-term rentals: which strategy fits you
06 What drives performance up or down
07 Honest assessment: the risks to know
Hurghada gets talked about a lot in investment circles, and the claims can range from the conservative to the extraordinary. Our aim with this guide is simple: give you the clearest, most grounded picture of what a vacation rental property in Hurghada can realistically earn — based on actual market data, not promotional projections.
We draw on data from multiple sources including Global Property Guide's Q4 2025 survey, short-term rental analytics platforms tracking over 3,000 active listings in Hurghada, and published market research from real estate agencies active in the Red Sea region.
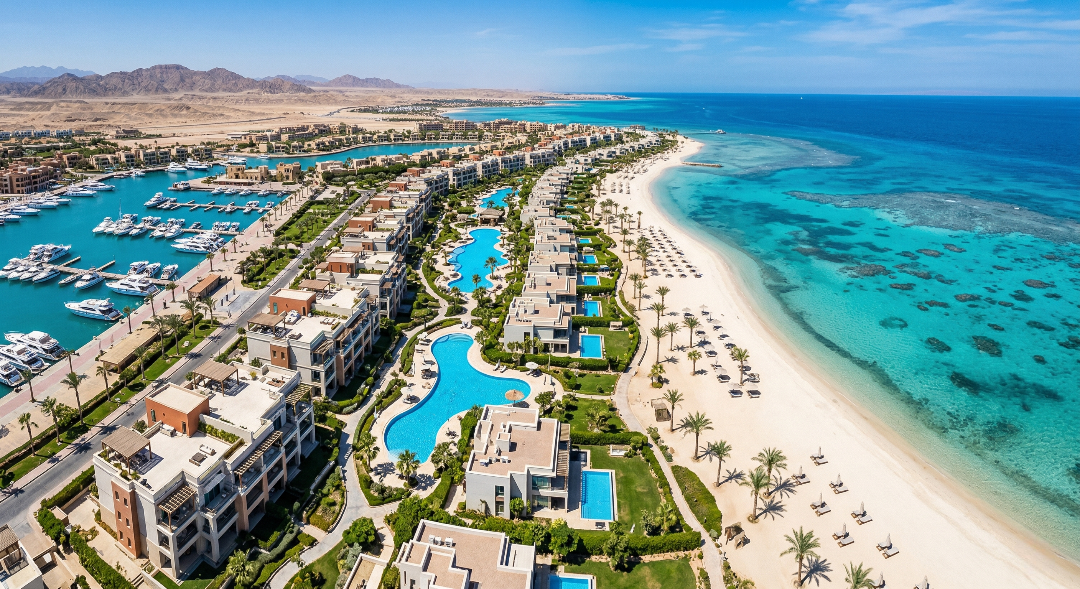
Why Hurghada Works as an Investment Market
Most beach resort property markets suffer from the same structural problem: they're seasonal. Six months of strong income, six months of near-zero demand. Hurghada is an exception — and that exception is the foundation of its investment case.
The city's location on the Red Sea gives it a genuine year-round climate. Winters are mild and sunny, drawing visitors from Russia, Eastern Europe, and the Gulf seeking warmth when their home countries are cold. Summers, while hot, attract domestic Egyptian travelers and Gulf families seeking beach holidays. Spring and autumn are peak diving and water-sports season, pulling in a distinct international audience.
The result is a tourism market that operates across all twelve months — something you cannot say about comparable coastal markets in Turkey, Spain, or even parts of Greece. This year-round demand directly translates into more bookable nights, more consistent occupancy, and more predictable rental income.
Market context
Hurghada receives over 2 million tourists annually. The city has an established and growing expat community that supports long-term rental demand alongside the short-term vacation market — giving investors two distinct income strategies to choose between or combine.
A second structural advantage is price. Compared to property markets in Turkey, Cyprus, Greece, or Dubai, Hurghada entry prices are significantly lower for equivalent quality. Lower acquisition costs mean the same rental income generates a higher percentage yield — which is why Hurghada's gross yields consistently exceed most Mediterranean alternatives.
Rental Yield Data: The Actual Numbers
Rental yield measures your annual rental income as a percentage of the property's purchase price. Here is what the data shows for Hurghada specifically.
Hurghada market data — 2025
7.3%City average gross yield (Q4 2025)
|
53%Median annual occupancy (STR)
|
$60Average nightly rate (USD)
|
$10KAvg annual STR revenue
|
The city average gross yield of 7.3% in Q4 2025, per Global Property Guide's Egypt residential market survey, sits well above Egypt's national average of 6.72%. Studios and one-bedroom units outperform the average, with yields of 8%+ in well-located vacation areas. Premium beachfront or sea-view properties in managed resort communities have been cited at 8–10% in multiple market reports.
For context: the UK buy-to-let market averages around 4–5% gross yield, Portugal's Algarve sits at roughly 4–6%, and most of Spain's costas range between 3–5%. Hurghada's 7–10% range is materially stronger — and that's before accounting for property price appreciation.
| Market | Avg. Gross Yield | Avg. Entry Price (1-bed) | Year-round season? |
|---|---|---|---|
| Hurghada, Egypt | 7–10% | $25,000–70,000 | Yes |
| Algarve, Portugal | 4–6% | $200,000–400,000 | Partial |
| Costa del Sol, Spain | 3–5% | $150,000–350,000 | Partial |
| Turkish Riviera | 4–6% | $60,000–200,000 | Partial |
| Dubai, UAE | 5–7% | $150,000–400,000 | Yes |
Note that these are gross yields — before management fees, maintenance, taxes, and vacancy. We address net yield and costs in detail in the worked example below.
More from Buying & investing.
Can foreigners buy in Hurghada?
Can foreigners buy property in Hurghada? Yes — and it’s easier than you think. Discover Egypt’s property laws, ownership rules, residency options, costs, and step-by-step buying process in this 2026 guide.
The As-home teamApr 11, 2026
Beyond the Red Sea: Why Hurghada is the Smartest Real Estate Investment in 2026
A comprehensive guide to investing in Hurghada real estate in 2026. Discover why the Red Sea offers Egypt's highest rental yields, how infrastructure is driving capital appreciation, and how to invest commission-free with As-home.
The As-home teamJan 19, 2026
مصيف اسكندرية سبتمبر ٢٠٢٦: البحر لسه دافي والمدينة بتفضى
مصيف اسكندرية في سبتمبر ٢٠٢٦: حرارة البحر حوالي ٢٧ درجة، الزحمة بتقل بعد بداية الدراسة يوم ١٢ سبتمبر، وإزاي تحجز شقة موثقة بتأكيد فوري ودفع بالكارت.
The As-home teamJul 26, 2026